
TIC Solutions: Thesis Check

Overview
I originally wrote about TIC before it went public and took apposition not long thereafter. Needless to say, I am not happy with the stocks performance since.
TIC Solutions reported its Q4 and full year 2025 results on March 12, 2026, which was the company’s first full quarter earnings release as a fully consolidated entity following its transformational merger with NV5. The results present the first real window into whether the “buy, integrate, improve, deleverage” playbook is actually working, as it did with API Group.
Q4 and FY 2025 Financial Results
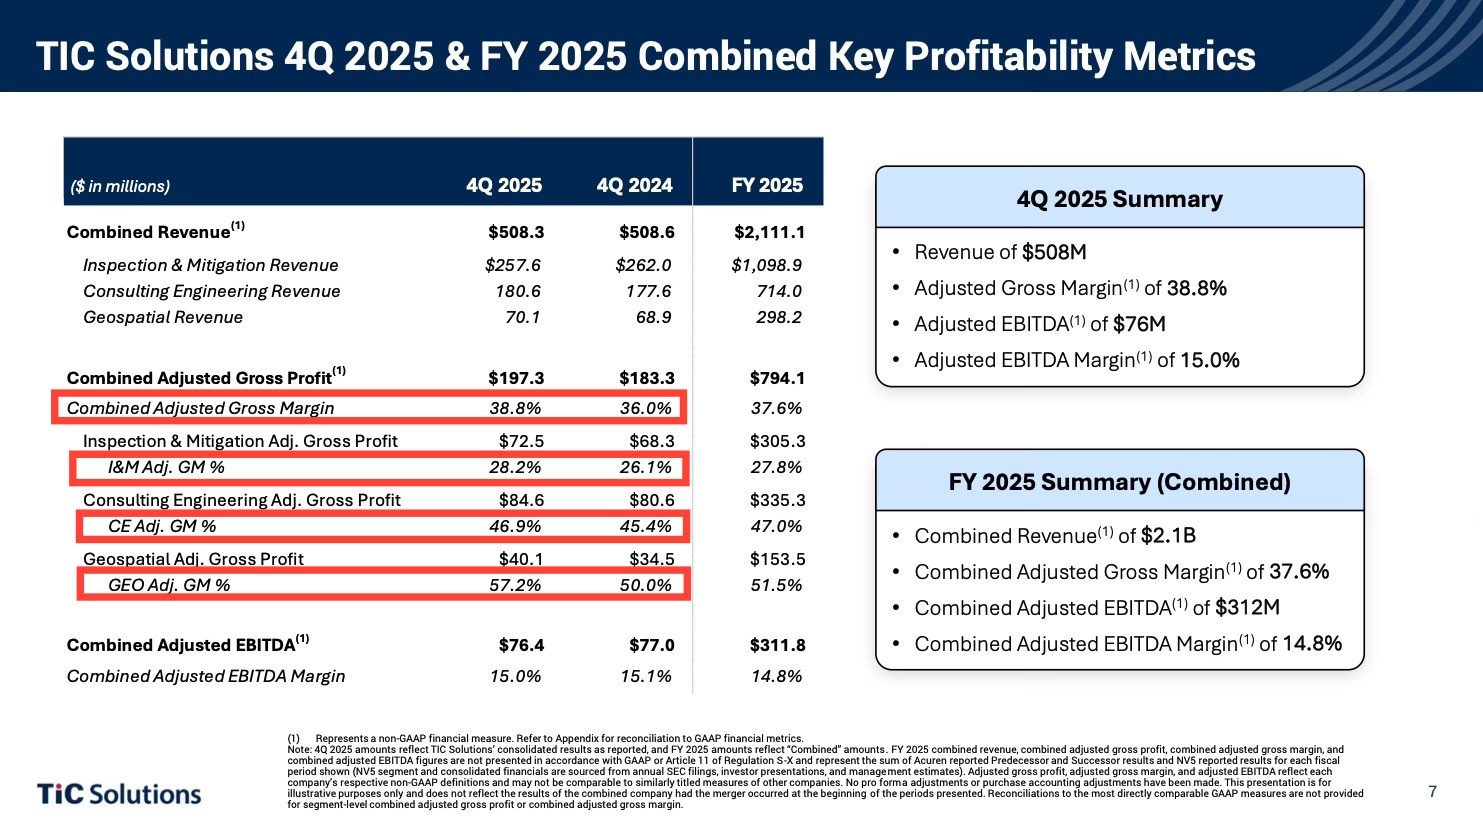
On a combined basis, Q4 2025 was certainly not a blowout quarter, in fact is was somewhat disappointing in terms or organic growth. But there were a few positive things if you look a bit deeper, namely, there was margin progression across every segment in Q4.
Let’s go through each segment break down what happened.
Inspection and mitigation — NDT, rope access, engineering, lab work · ~52% of combined revenue
This is the largest segment with the lowest growth, which inevitably makes this the problem child of TIC’s portfolio right now. At ~52% of revenue, flat growth is a big drag on consolidated results, even though the other segments did well.
Adjusted gross margin was down 70bps on the full-year, but there was a 210 bps margin recovery in Q4 to 28%, but it wasn’t quite enough to make up for a bad year. The bad year is party because of lost work in the Gulf coast. Management appears to be framing it as a deliberate, principled decision to protect margins.
“Competitive intensity in the region remained elevated during 2025, and we stayed disciplined on pricing while tightening account coverage and improving staffing and resource deployment.”
“We remain focused on margin quality, and we continue to pursue work that meets our margin thresholds. We maintain pricing integrity even when competitors were more aggressive, and we will not trade long-term economics for short-term volume.”
- Ben Heraud, Q4 call
This seems to imply that it was intentional, however, management also said they had “a few site losses amid elevated competition”
From managements’s comments, investors can't fully disentangle how much of the Gulf Coast volume decline was intentional discipline versus genuinely losing to competition. This is part of the frustration I think some investors are having, including me.
The unfortunate aspect of this situation is that this is the segment of the business that investors want to grow! It’s the recurring maintenance component of the business that does mandatory testing and inspections. It’s also the higher EBITDA margin segment.
Consulting and engineering— infrastructure, buildings, data centers, utilities, environmental · ~34% of combined revenue
CE was much better with 8% growth for the full-year and 2% in Q4, and saw gross margin lift to 47%. This segment is performing above expectations in my view. The data center business that NV5 built is the most interesting asset in their portfolio right now because it high margin, high growth, and embedded with hyperscalers.
CE did $714m in revenue for 2025, of which $70m is tied to data centers. That data center revenue grew 100% from the previous year and is expected to grow 30% in 2026. Even so, data centers still only contributes to ~3% of sales as of now. If this business continues to grow at a high rate for the next 5 years, this could become a meaningful part of the business and potentially drive margins and long term recurring inspection and mitigation. I&M just secured its first data center NDT engagement (radiographic testing of critical mechanical systems) which opens the door to more long term inspection work. Ultimately, that’s the plan, TIC is trying to drive long term, recurring inspection revenue by creating relationships with NV5’s customers.
Geospatial— mapping, LiDAR, analytics, software · ~14% of combined revenue
GEO grew 6% on the year, and 2% growth in Q4, which was allegedly constrained by a federal funding lapse. GEO is a high-quality, structurally sound segment that had a lower margin year from federal work instead of its higher margin commercial work. Full year gross margin was down 210 bps to 51.5%, but Q4 recovery was huge at 57.2% (up 720 bps) from favorable project mix, higher-margin commercial and analytics work.
Putting it al together
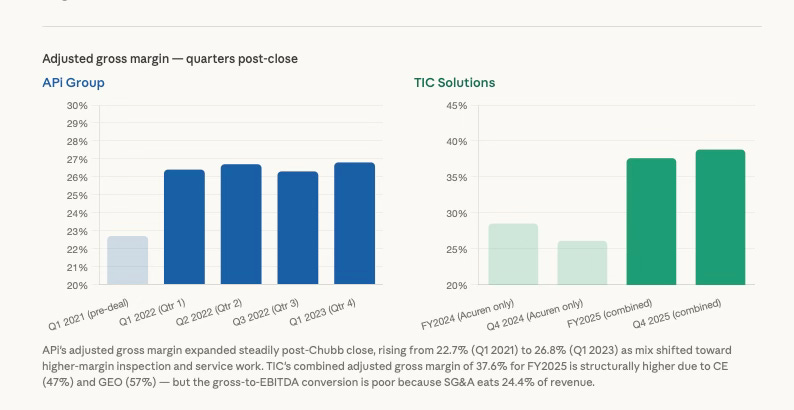
TIC is basically two businesses, GEO/CE (NV5 businesses), and I&M (the legacy Acuren business). I&M is going through a rough patch but GEO and CE are doing exactly what we were told they would do in the post-merger period. They are growing faster, carrying higher margins, and beginning to generate leads for I&M, albeit small lead so far. Together, GEO and CE represent ~48% of revenue and the combined year-end backlog was $1.07 billion, up ~10%. CE and GEO are actually improving the blended gross margin over time as evidenced by the 37.6% full-year blended gross margin, which is already well above what legacy Acuren had on its own (~28%).
The problem is the gap between gross margin and EBITDA. This is partially due to an SG&A load (24% of revenue), and until it comes down toward the ~20% range, EBITDA margins stay surpassed. Management said they aspire to a 20% EBITDA margin in the long term, which is exciting, but bridging the gap from 14.8% to 20% requires a ~520 basis point expansion. The $25M synergy program could add ~110–120 bps on $2.1B revenue by reducing the SG&A load, but the remaining ~400 bps almost certainly has to come from revenue mix shift (more CE and data center, less low-margin I&M), I&M operational improvement, and operating leverage. This is all achievable on a multi year horizon, but this isn’t a near term story. More will be revealed over the coming quarters. I would be very surprised if they don’t release a set of targets similar to API’s “13/16/80” framework, where margin, mix and FCF conversion are targeted.
Comparing the API-Chubb and TIC-NV5 deals
Many, including myself, were hoping for an “API 2.0” because the similarities between the two companies and the shared DNA via Sir Martin Franklin, who sits as Executive Chairman of both companies. Both companies did large transformational deals that follow the same template where they acquire an underperforming complementary business, integrate via operational discipline and mix-shift, and deleverage using the combined platform's cash flow. Given the success of the API-Chubb deal, it serves as a good benchmark. But I will acknowledge that comparing them is not exactly apples-to-apples. They are different companies, in different industries, that did transformational deals in different macro environments. Nevertheless, they have enough in common to compare.
My conclusion is that so far, TIC is not quite API Group 2.0. and it’s mostly because of low organic growth.
I’m going to walk through the first few quarters of the APi-Chubb deal side by side with TIC-NV5 in order to compare.
One side note: API-Chubb closed January 2022, and TIC-NV5 closed august 2025. It’s technically been 2 quarters since the TIC-Chubb deal closed, but the first one (July–September 2025) is only a partial quarter (2 months) with NV5 given the deal closed in August. Regardless, its still gives a decent comparison. Let’s go through it.
Leverage
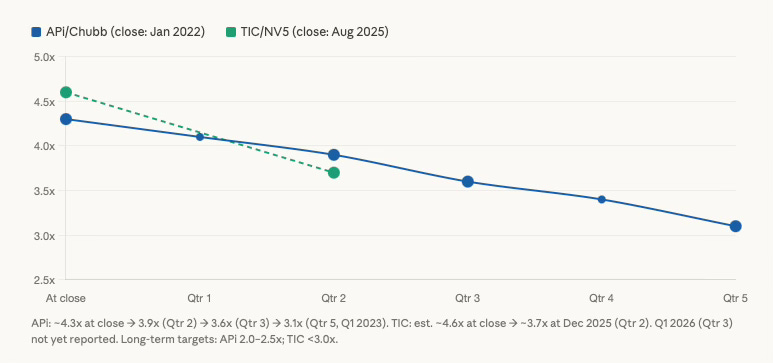
Both companies closed with high leverage, API with 4.3x net leverage and TIC with 4.6x. However, API was at 3.1x just few quarters after the close, where TIC is at roughly 3.7x in its first true quarter after close (combined basis). This is one point for TIC, but they need to continue growing cash flow to reduce this. The main reason API did so well in the first year is because of the impressive growth in cash flow the company saw after the deal. That said, TIC's deal is much more recent and the period covered is shorter, so the trajectory in the coming quarters will be more telling.
I imagine that once leverage is at a more manageable level, they will begin tuck-in acquisitions.
Organic/Inorganic growth
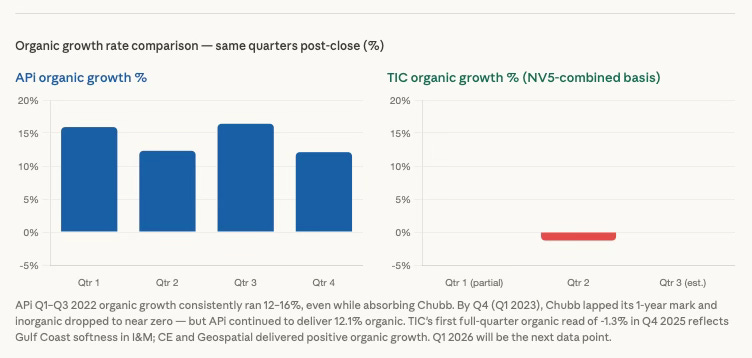
Here is probably the most notable difference between the two companies. API’s organic revenue grew 15.9% in the first full quarter on 83% total revenue growth. By Q3 2022, organic growth was an incredible 16.4%, and it was all being driven by the inspection, service and monitoring segment. Despite prior years of near-zero growth, Chubb alone delivered approximately 3% organic growth in the YTD period through Q3 2022, against a 5-year pre-COVID CAGR of essentially 0%.
TIC did report 2% organic growth for FY 2025 on a combined basis, but it also reported -1.3% organic in Q4, which again, to be fair was at least partially driven by Gulf Coast softness and turning down work. But regardless, it's hard to make a case that TIC is the next API when organic growth isn’t anywhere near the same. I am interested to see if TIC can turn a corner this year.
Margins
Adjusted EBITDA
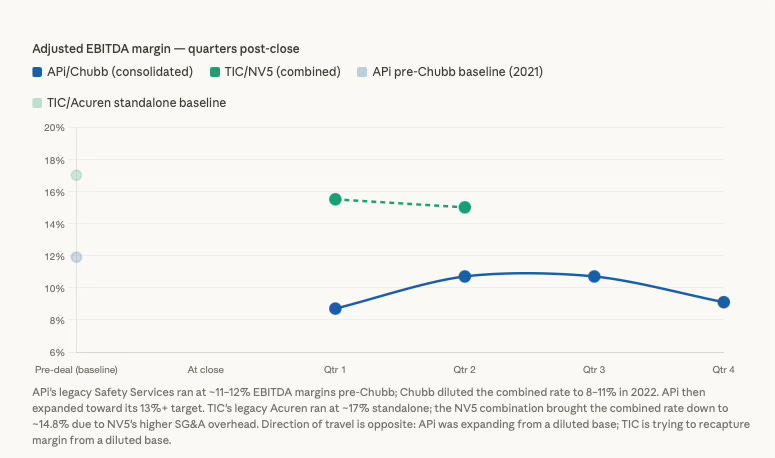
API entered the Chubb deal with the legacy business running at ~11–12% EBITDA margins, and Chubb's ~9% margin diluted the combined rate down to 8.7% in Q1 2022. From there the company saw expansion toward 13%+ over time, with a few hiccups along the way. Keep in mind, API's initial margin rebound was very much helped by organic revenue growth.
The net effect of the TIC-NV5 merger was gross margin accretion and EBITDA margin dilution, because while NV5 is high gross margin and lower EBITDA margin business compared to Acuren. This is largely a function of who they employ and where those employees sit on the p&l. NV5 employs many engineers and consultants, which shows up in SG&A, while Acuren employs field technicians who show up in COGS. The $25M synergy program is primarily targeting NV5’s excess SG&A precisely because that’s where the margin leak is.
Valuation
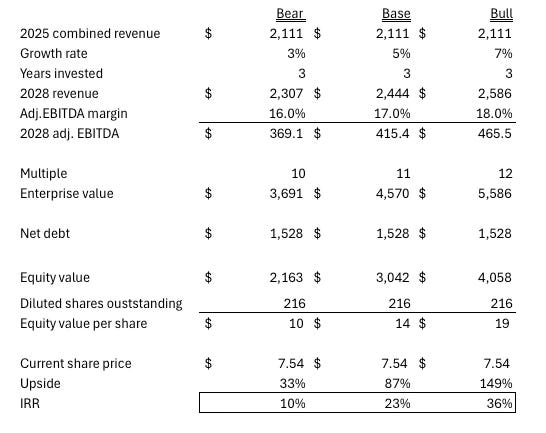
I originally penciled out a base case with 5-15% growth and a 2028 Adj. EBITDA margin of around ~18-19%. This assumed more organic growth and a recovery to Acurens legacy margin profile and then continued expansion. Given the current trajectory it seems like my base case may have been too optimistic, and 19% EBITDA margin may been a bit aggressive. If we update the model with much lower assumptions, like margins between 16-18%, slower growth rate between 3-7% and a $7.54 starting price, we get a potentially good return from here.
Final thoughts
For now, I am keeping this position and watching results, but will consider trimming a bit if results continue to underperform going forward. Unfortunately my cost basis is $10.84, so I would have to average down quite a bit to get a reasonable return. I thought about averaging down, but I’m not a big fan of averaging down on a loser unless there is a really obvious opportunity. Right now, It just not obvious to me. I want TIC to prove itself on margin and growth. If I’m missing something, I would love to hear what it is.
Anyways, thank you for reading. That’s it for this week.
Nice overview mate. TIC is a very interesting story, but man it’s hard to get confidence based on what we see currently. Kind of a wait and see for me.