
TIC Solutions Update: New performance framework and a path to $26+ per share.

Key details
Ticker: TIC 0.00%↑
EV/EBITDA (2026 mid-point): 8.8x
Upside: 100% - 200% if management successfully executes on 2029 framework.

In my last TIC article, I discussed how I was frustrated by TIC”s recent performance, and so I took advantage of the pop after 2026 Q1 earnings to trim my position down to a 3-4% position. I originally underwrote a smoother integration and more organic growth and didn’t get that, so I trimmed.
A few weeks later I’m questioning that decision after The Investor Day. Management provided a meaningful step up in investor communication with TIC’s first explicit multi-year performance framework, which is similar to the one that APi Group had.
The frame work:
$3b + in revenue
18% + adjusted EBITDa margin
85% + free cash flow conversion
Before we dig in deeper, let’s first start with a summary of the Q1 results.
Q1 2026 results
The good
Progress in the two NV5 legacy segments. Total revenue came in at $488m, and organic growth turned positive at 2.2%, compared to the negative organic post in Q4 2025.
Consulting Engineering revenue grew 9.5% Y-o-Y to $187m, adjusted gross margin expanded to 47.6%, and the segment's adjusted gross profit grew 11% to $89m.
Geospatial grew 4.5% to $66m in revenue. The segment continues to benefit from recurring utility-line flying work
Synergy execution accelerated ahead of schedule. Of the $25m cost program, ~$17m has been actioned.
The Bad
The I&M segment, which is ~52% of combined revenue, was essentially flat and adjusted gross margin compressed 80 bps to 24.4% from 25.2% a year prior.\
The overall EBITDA margin trajectory is essentially flat.
Cash flow was thin at $10m operating cash flow against $6m capex, producing minimal free cash flow. Schultes flagged two large project billings that slipped from late March into early April as a timing issue already resolved.
Investor day
Here are some 6 things that stood out from the investor day.
1. The “3/18/85” Financial Framework
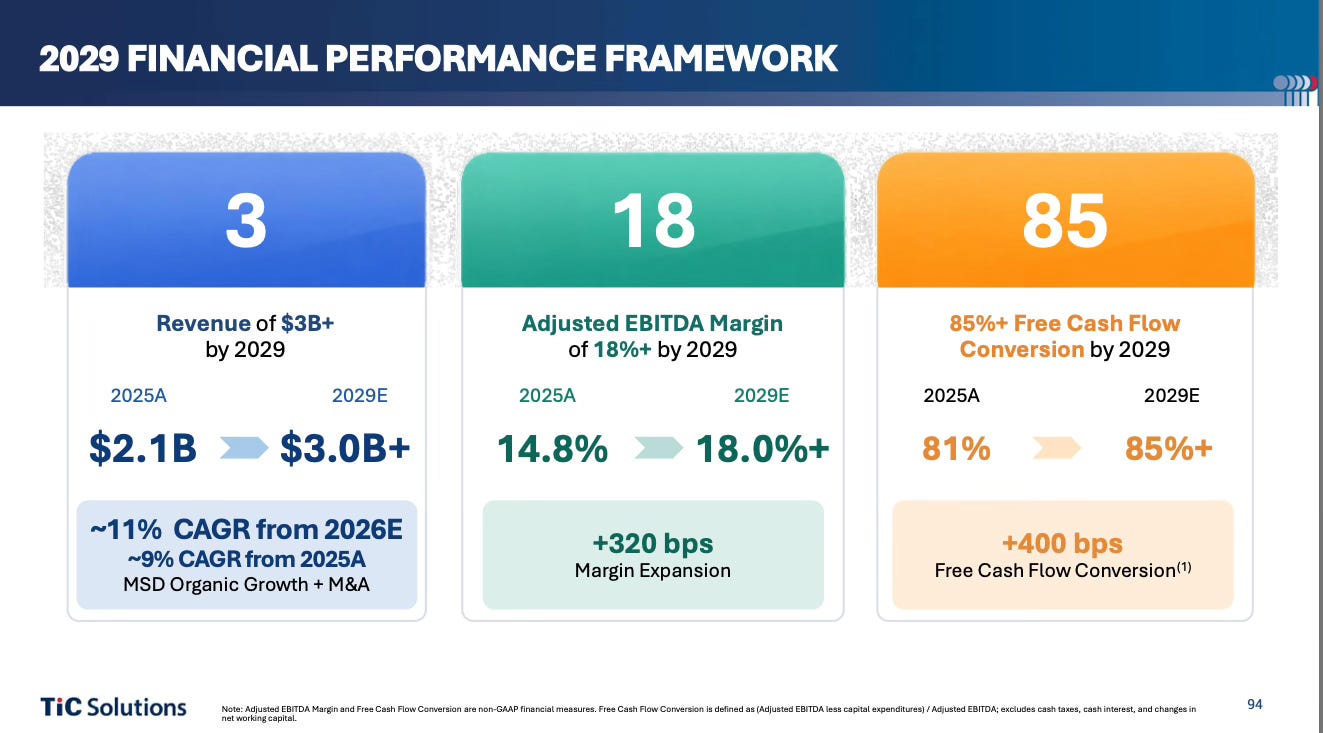
The focal point of the investor day was the introduction of a three-year performance framework. Management unveiled the 3/18/85 framework, targeting $3 billion in revenue, 18% adjusted EBITDA margin, and 85% free cash flow conversion, all by 2029.
CFO Kristin Schultes explicitly modeled this after the APi Group playbook, she worked at APi during its early public years, where a similar framework (”13/60/80”) became a rallying point. It serves as both an external communication tool for investors and an internal operating framework for management to measure decisions against.
The framework assumptions
Revenue grows from $2.1b to $3.0b via an ~11% CAGR from 2026 estimated revenue, split between mid-single-digit organic growth (~$500m+) and $100–150m of annual M&A spend (~$400m contribution).
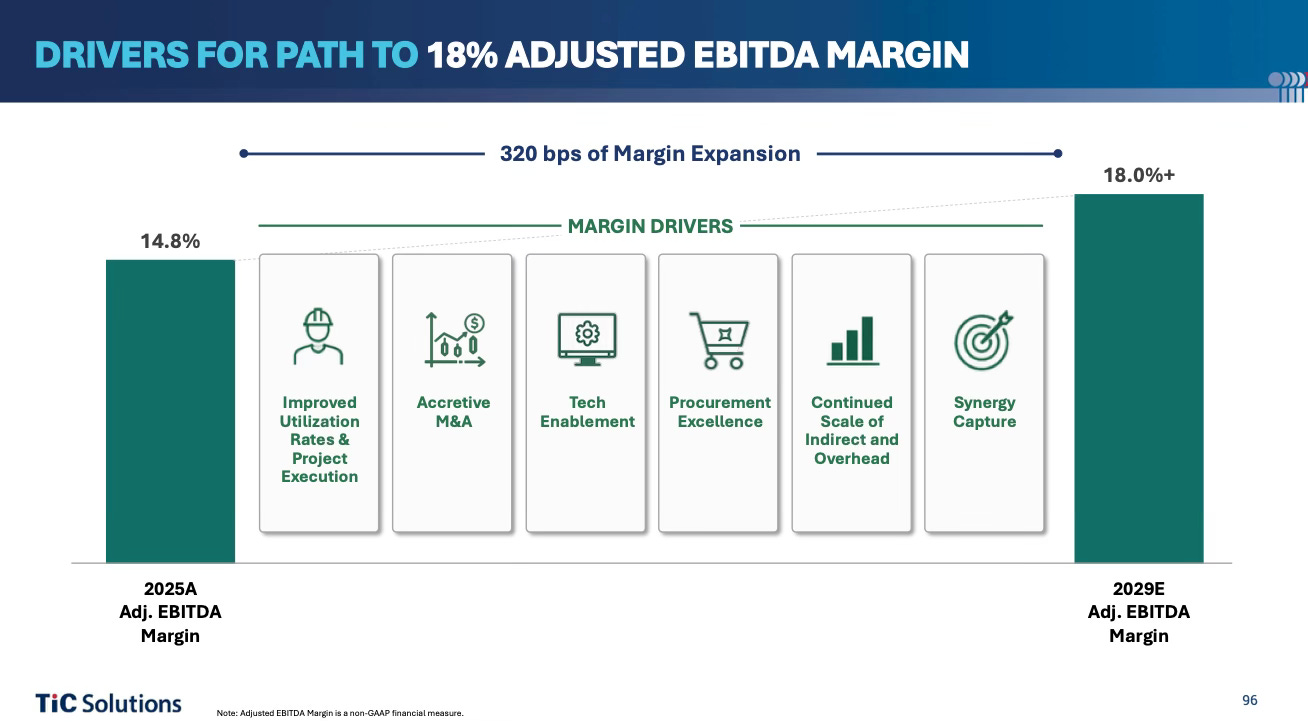
Margin expands 320 bps from 14.8% to 18%+, driven by utilization improvement, synergy capture, tech enablement, procurement excellence, and accretive M&A.
FCF conversion improves from 81% to 85%+, aided by DSO reduction, disciplined capex, and declining interest expense as leverage falls.
Revenue math is manageable but M&A-dependent
The 2029 target of $3b+ requires roughly ~$900m of incremental revenue from the 2025 figure, or $870–890m from 2026 guidance. Either way, we’re looking at ~$500m from organic and~ $400m from m&a contribution, which implies ~11% CAGR from 2026.
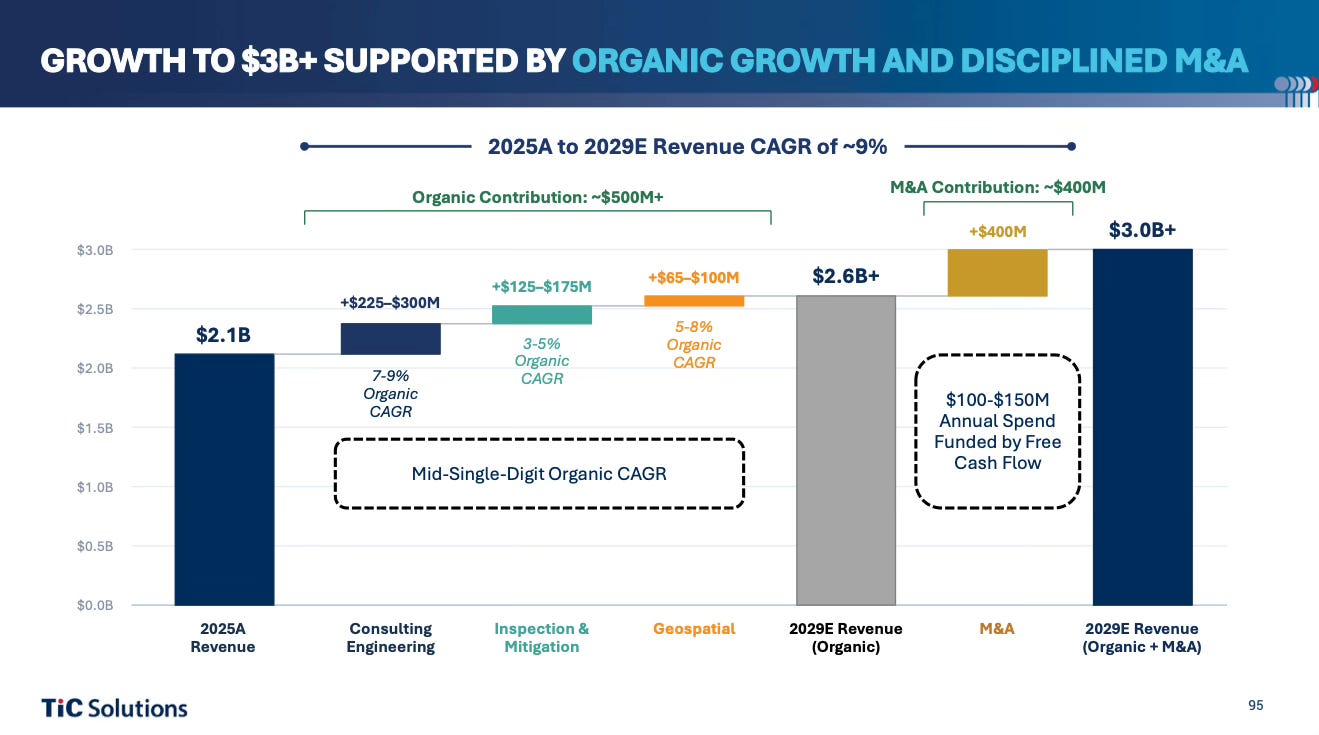
In contrast to APi Group, the inspection segment will not be the primary driver of growth at TIC. Instead, Consulting and Engineering will be leading the charge with higher margins. The margin story improves as mix shifts away from I&M. I&M carries a 27.8% gross margin versus CE at 47% and GEO at 51.5%.
The m&a framework assumes $400m, and it will be funded by free cash flow, which over three years they expect to produce $500m cumulatively. The free cash flow piece is important because without it they will be reaching for debt or equity, and given current leverage, equity is more likely.
Margin is where the real execution risk lives
The relevant baseline is FY2025’s 14.8% adj EBITDA margin. The 2026 guided margin is ~15.6%, so roughly 80 bps of progress is expected this year. From there, reaching 18% by 2029 requires another 240 additional bps over three years, or ~80 bps/year. Management’s levers are synergy capture, improved utilization, tech enablement, procurement excellence, continued SG&A scale, and accretive M&A. This is really where management will have to prove themselves. After the investor day framework came out, the stock did nothing, so the market is basically saying “prove it”.
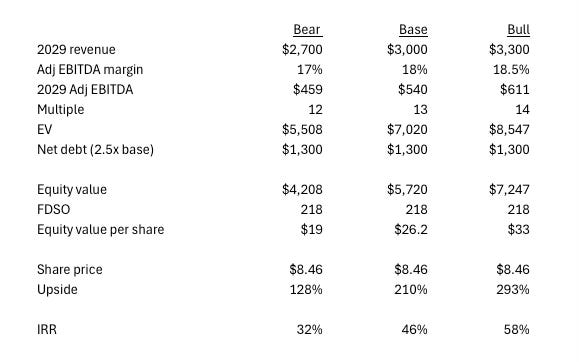
$540m implied adjusted EBITDA
FY2025 adjusted EBITDA was $312m. At 18% margin on $3b+, 2029 EBITDA would be approximately $540m, a 73% increase over four years. That is substantial, and I will provide a bear case in the valuation where they miss this.
FCF conversion is the easiest part of the three
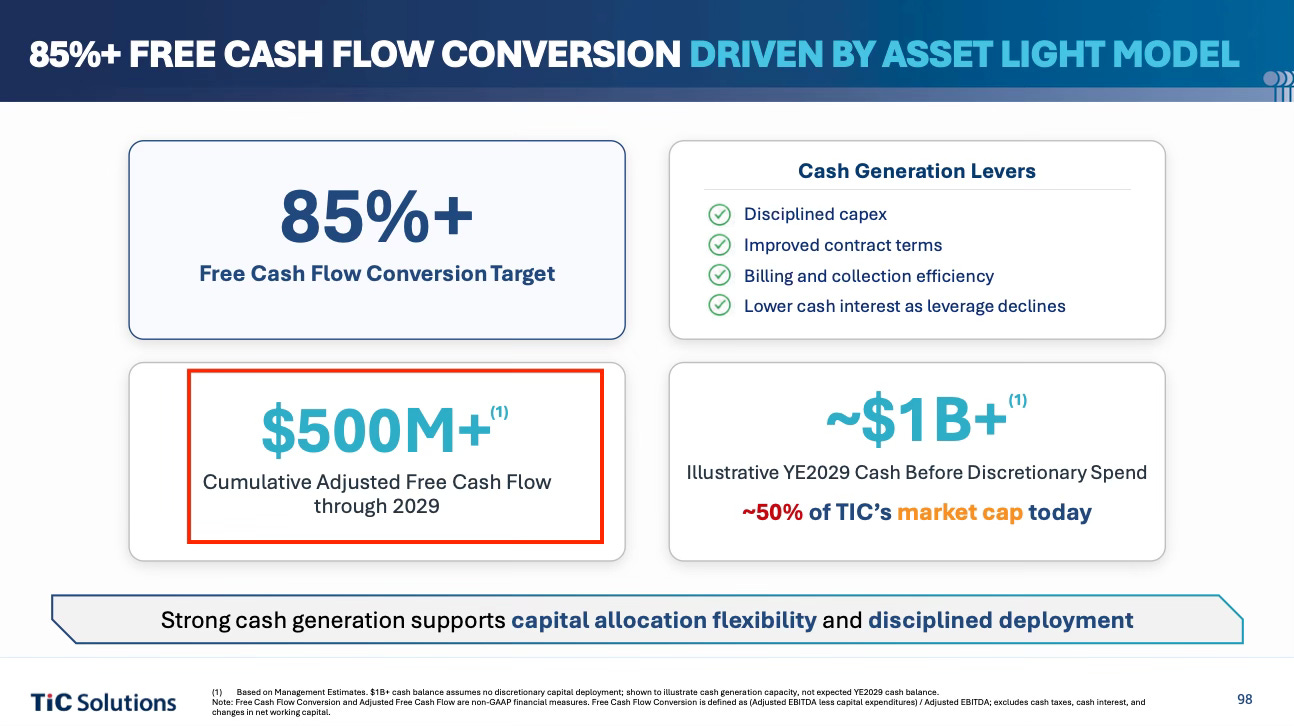
Current FCF conversion was 81% in FY2025, and the target is 85%+. The improvement path will be disciplined capex, improved contract terms, billing and collection efficiency, and lower cash interest as leverage declines.
This is the least aggressive target in the framework. The interest savings alone as they deleverage from ~3.8x toward 2.5x will help meaningfully.
2. Segment-Level Organic Growth Targets and mix shift
CE expected to grow at 7–9% organic CAGR
GEO at 5–8%
I&M at only 3–5%
They don’t detail where inorganic growth will be layered in, but I can assume GEO and CE will get priority given that they are higher margin.
I&M is basically expected to stabilize the platform and contribute steady cash generation while CE and GEO are the growth engines. I&M’s growth also implies the ongoing Gulf Coast NDT recovery, which management framed as fixing regional leadership issues to return the business to a growth path.
Using this assumptions, one could reasonably conclude that by 2029 CE will likely make up ~40% of revenue, I&M could make up ~45% and GEO would be ~15%.
3. End Market Diversification— Oil & Gas De-risked
The Acuren-NV5 merger reduced Acuren’s legacy oil & gas exposure from 40% down to 20% of revenue. This is clearly an improvement to the over-all platform given macro uncertainty around energy capex.
4. Data Center Rapid Growth — But Not A Data Center Story
Data center revenue reached nearly $70m in 2025, more than doubling versus the prior year, with management citing line of sight to nearly $100m in 2026, supported by contracted backlog and programmatic client engagements.
Citrini wrote an article that sent the stock up 14% in a day. It was apparently about how TIC was going to be a “Data Center maintenance business with recurring revenue,” and no offense to Citrini, but that’s just intellectually dishonest given that only 3-4% of revenue is tied to data centers. TIC is currently no more a data center business than Costco is a Hot Dog restaurant.
It’s possible that NV5 acquires its way into a larger share or the data center build out, but I’m not holding my breath for a reasonable multiple for any company tied to data centers.
5. Capital Allocation — Revised Leverage Target (Important)
Management’s North Star for net leverage is now 2.5x or below, which is better than prior target of sub-3x. This is bullish if delivered, but it implies less m&a flexibility than prior framing suggested.
Management also disclosed that they expect $500m+ of cumulative adjusted FCF expected through 2029, representing a potential $1b+ cash position by 2029 before any discretionary deployment, which they noted is approximately 50% of TIC’s current market cap.
6. M&A Pipeline
Management stated that several high-quality targets are currently under LOI, expected to close within 30–60 days, which would bring H1 2026 capital deployment to over 50% of the annual target. Annual m&a spend is targeted at $100–150m, at 5–8x EBITDA / 1–1.5x revenue.
Valuation
Currently, TIC is largely disliked by the market, and for good reason. It’s highly levered, and the merger integration has proven to be less than ideal. It’s not really the ideal Marco environment for this type of business. But, in this pessimism lies a potential opportunity. However, the company will have to prove itself to gain the confidence of investors. Until there are material improvements in margins and growth, I expect the share price to continue hovering between ~$8-$11 per share.
Below is the model with the bae case in line with managements performance framework. The bear case assumes some progress, they miss the revenue and margin targets, and so the multiple is lower at 12x.
Bull case assumes they surpass revenue and margin targets and are assigned a slightly higher multiple of 14x.
Final thoughts
This doesn’t look bad to me. Even the bear case could turn out well. I sold 30% of my position at cost, and I did this because the fundamentals weren’t panning out and the integration was off to a rough start. But now management is saying they will live up to my expectations, so I have an opportunity to buy back in at a lower price. I am seriously considering it.
That’s it for this week. Thanks for reading.